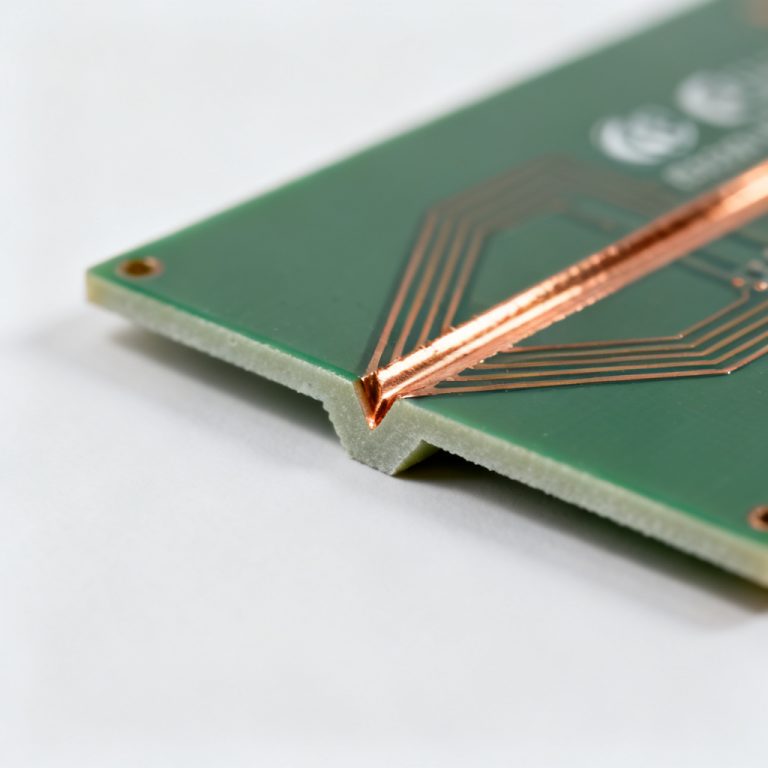
Material Properties Database Tg Dk Df CTE
This definitiveMaterial Properties Database Tg Dk Df CTE —that define PCB laminate performance. Understanding these properties is essential for engineers and procurement professionals selecting materials for high-reliability printed circuit boards. Whether you design for high-speed digital, RF, or harsh thermal environments, this guide provides authoritative insights from industry-leading sources.
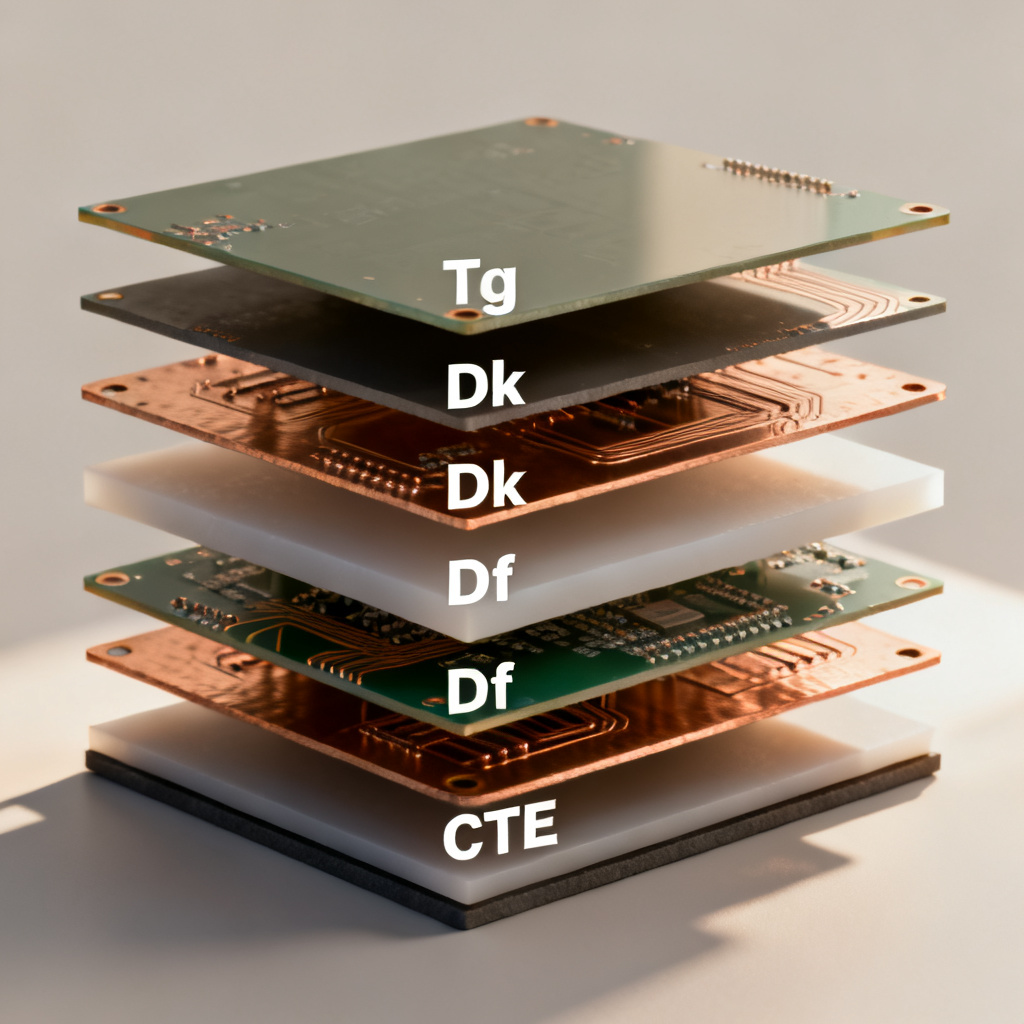
Glass Transition Temperature (Tg) in Material Properties Database
What Is Tg and Why It Matters
The Glass Transition Temperature (Tg) is the temperature at which a cured resin system transitions from a rigid, glassy state to a softer, rubbery state. Below Tg, the material is hard and dimensionally stable; above Tg, it expands significantly, loses mechanical strength, and becomes more flexible. In the context of a Material Properties Database, Tg directly affects thermal reliability during soldering and operation.
Thermal Reliability and Z-Axis Expansion
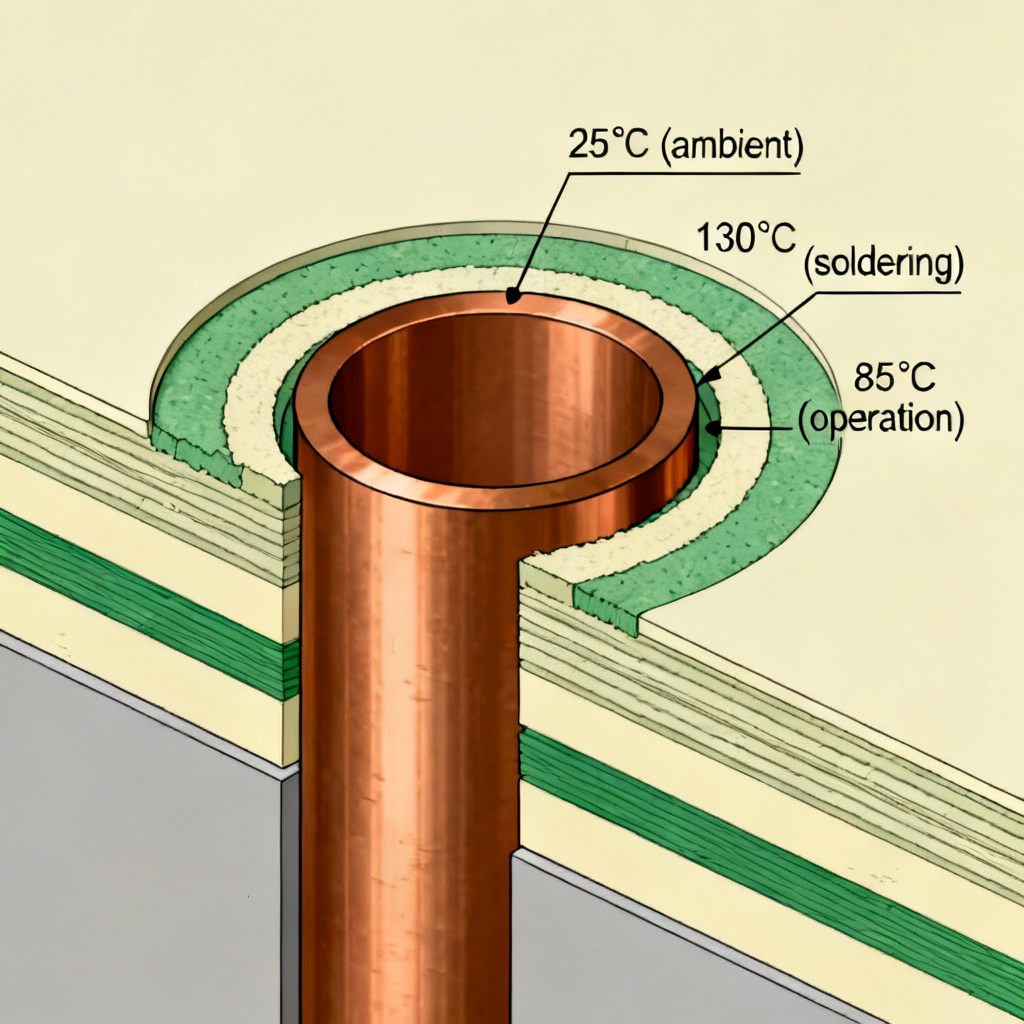
A higher Tg material maintains mechanical integrity during lead-free reflow at 260°C and in high-temperature operating environments. If the PCB exceeds its Tg, the resin softens, leading to potential barrel cracking in plated through-holes (PTH) and delamination. The most critical impact of Tg is on Z-axis expansion: below Tg, the coefficient of thermal expansion (CTE) is relatively low; above Tg, CTE increases dramatically—often 3–4 times higher—causing severe stress on copper vias and interconnects.
Industry Standard Tg Values (from IPC-4101)
| Material Properties Database – Tg Grade | Tg Range (DMA, °C) | Typical Applications |
|---|---|---|
| Low Tg (Standard FR-4) | 130–140 | Basic consumer electronics with low thermal demands |
| Mid Tg (Enhanced FR-4) | 150–160 | Commercial and industrial applications |
| High Tg | 170–180 | Automotive, industrial control, telecom infrastructure |
| Ultra-High Tg | >200 | High-layer-count, heavy copper, military/aerospace |
Measurement Methods: DMA vs. TMA vs. DSC
Tg can be measured using three primary methods. DSC (Differential Scanning Calorimetry) measures change in heat capacity and yields the lowest Tg value. TMA (Thermomechanical Analysis) measures dimensional expansion and provides the most practical Tg for PCB reliability. DMA (Dynamic Mechanical Analysis) measures change in modulus and typically gives the highest Tg value. IPC recommends DMA as the most sensitive method for laminate characterization. Always check which method was used when consulting a Material Properties Database.
Dielectric Constant (Dk) in Material Properties Database
What Is Dk and Why It Matters
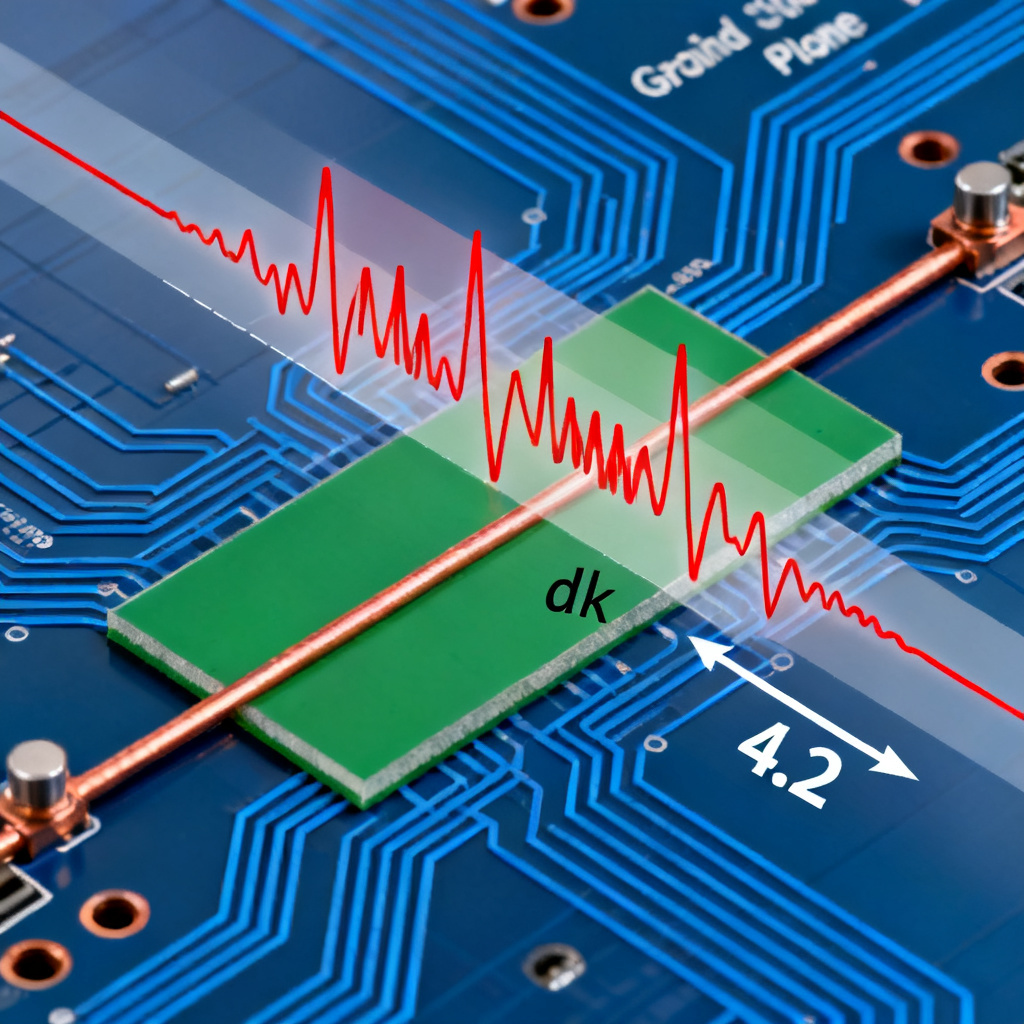
The Dielectric Constant (Dk), also known as Relative Permittivity (εr), measures a material’s ability to store electrical energy in an electric field. In a Material Properties Database, Dk is the primary factor determining characteristic impedance of transmission lines. A higher Dk results in lower impedance for the same trace geometry. For high-speed digital signals like PCIe, DDR, and USB, consistent Dk across the board is critical to avoid signal reflections and impedance mismatch.
Signal Propagation and Frequency Dependence
Propagation velocity is inversely proportional to the square root of Dk. Lower Dk materials allow signals to travel faster, making them preferred for high-frequency RF designs. Dk is not a constant—it decreases with increasing frequency. A material rated at Dk 4.5 at 1 MHz may drop to Dk 4.0 at 10 GHz. Always use the Dk value specified at your operating frequency when referencing a Material Properties Database.
Resin Content, Glass Style, and Moisture Effects
The Dk of a laminate is a composite of resin (lower Dk) and glass weave (higher Dk). Higher resin content lowers overall Dk. The glass style—1080, 2116, 7628—also affects Dk; tighter weaves with more glass increase Dk. Water has a very high Dk (~80), so moisture absorption can significantly increase effective Dk, degrading impedance control. Low-moisture-absorption materials are critical for high-reliability designs.
Typical Dk Ranges for Common Materials
| Material Properties Database – Dk Category | Dk Range (at 1 GHz) | Best For |
|---|---|---|
| Standard FR-4 | 4.2–4.8 | Low-frequency digital and analog |
| Mid-Loss FR-4 (e.g., Isola 370HR) | 4.2–4.4 | High-layer-count digital with moderate speed |
| Low-Loss / High-Speed (e.g., Isola FR408HR) | 3.6–4.0 | 10G+ backplanes and high-speed networking |
| RF / Microwave (e.g., Rogers RO4000) | 2.2–3.5 | Antennas, power amplifiers, mmWave applications |
Measurement Methods
IPC TM-650 2.5.5.5 (Stripline Method) is the most common and accurate method for laminates. IPC TM-650 2.5.5.9 (Clamped Stripline) is used for thin materials. Full Sheet Resonance measures Dk across a large panel for production quality control. For impedance-controlled designs, the Dk at your target frequency is the only value that matters in a Material Properties Database.
Dissipation Factor (Df) in Material Properties Database
What Is Df and Why It Matters
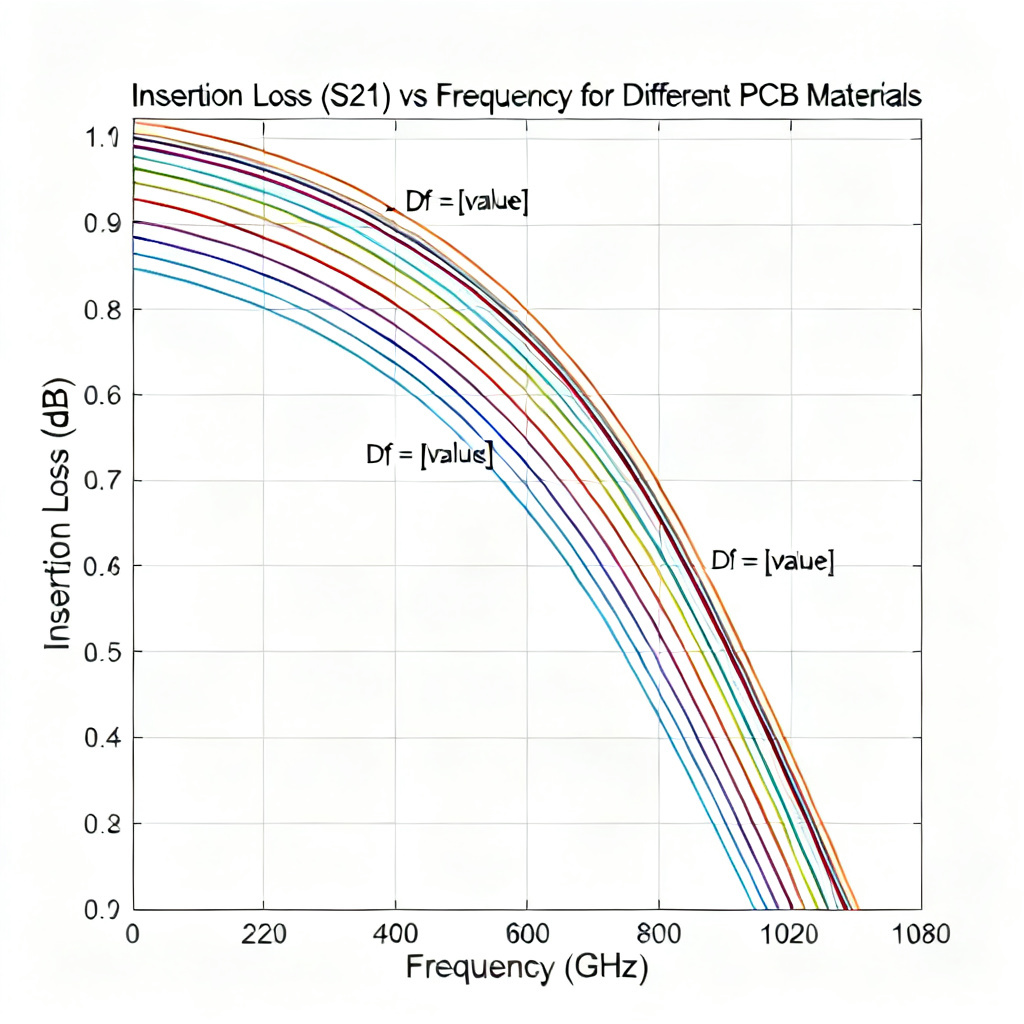
The Dissipation Factor (Df), also known as Loss Tangent (tan δ), measures energy lost as heat when an electric field passes through a dielectric. A lower Df means less signal loss and less heat generation. In a Material Properties Database, Df is the dominant contributor to dielectric loss in high-frequency signals. As frequency increases, loss due to Df increases linearly.
Signal Attenuation and Q Factor
For high-speed digital and RF applications, minimizing Df is the single most important factor in reducing signal degradation over long traces. In high-power RF circuits, a high Df can cause self-heating of the dielectric, leading to thermal runaway. In resonant circuits, the Q factor is inversely proportional to Df—a lower Df yields a higher Q, meaning sharper resonance and better selectivity.
Frequency Dependence and Resin Chemistry
Unlike Dk, Df generally increases with frequency, though the rate varies by material. PTFE-based materials have a very flat Df vs. frequency curve, ideal for broadband applications. The resin system is the primary driver of Df: epoxy resins have relatively high Df (~0.02), while hydrocarbon/ceramic or PTFE resins have Df values as low as 0.001–0.005. Copper foil roughness also affects Df at very high frequencies above 10 GHz.
Typical Df Ranges for Common Materials
| Material Properties Database – Df Category | Df Range (at 1 GHz) | Best For |
|---|---|---|
| Standard FR-4 | 0.020–0.025 | Low-frequency (<1 GHz) applications |
| Mid-Loss (e.g., Isola 370HR) | 0.010–0.015 | Moderate-speed digital (up to 5 Gbps) |
| Low-Loss (e.g., Isola FR408HR) | 0.006–0.010 | 10–25 Gbps applications |
| Very Low Loss (e.g., Rogers 4350B) | 0.0037 (at 10 GHz) | 5G, radar, automotive sensors |
| Ultra-Low Loss (e.g., Rogers 5880) | 0.0009 (at 10 GHz) | mmWave, satellite, high-end test equipment |
Measurement Methods
IPC TM-650 2.5.5.5 (Stripline Method) measures both Dk and Df simultaneously. IPC TM-650 2.5.5.1 (Capacitance Method) is used for low-frequency measurements. Split Post Dielectric Resonator (SPDR) is a non-destructive method for thin substrates at specific frequencies. For any design above 1 GHz, Df is more critical than Dk.
Coefficient of Thermal Expansion (CTE) in Material Properties Database
What Is CTE and Why It Matters
The Coefficient of Thermal Expansion (CTE) describes how much a material expands or contracts with temperature change, expressed in ppm/°C. For PCBs, CTE is measured in X, Y, and Z axes. The Z-axis CTE is the most critical for reliability. In a Material Properties Database, CTE directly impacts plated through-hole (PTH) reliability, solder joint stress, and board warpage.
PTH Reliability and Thermal Cycling
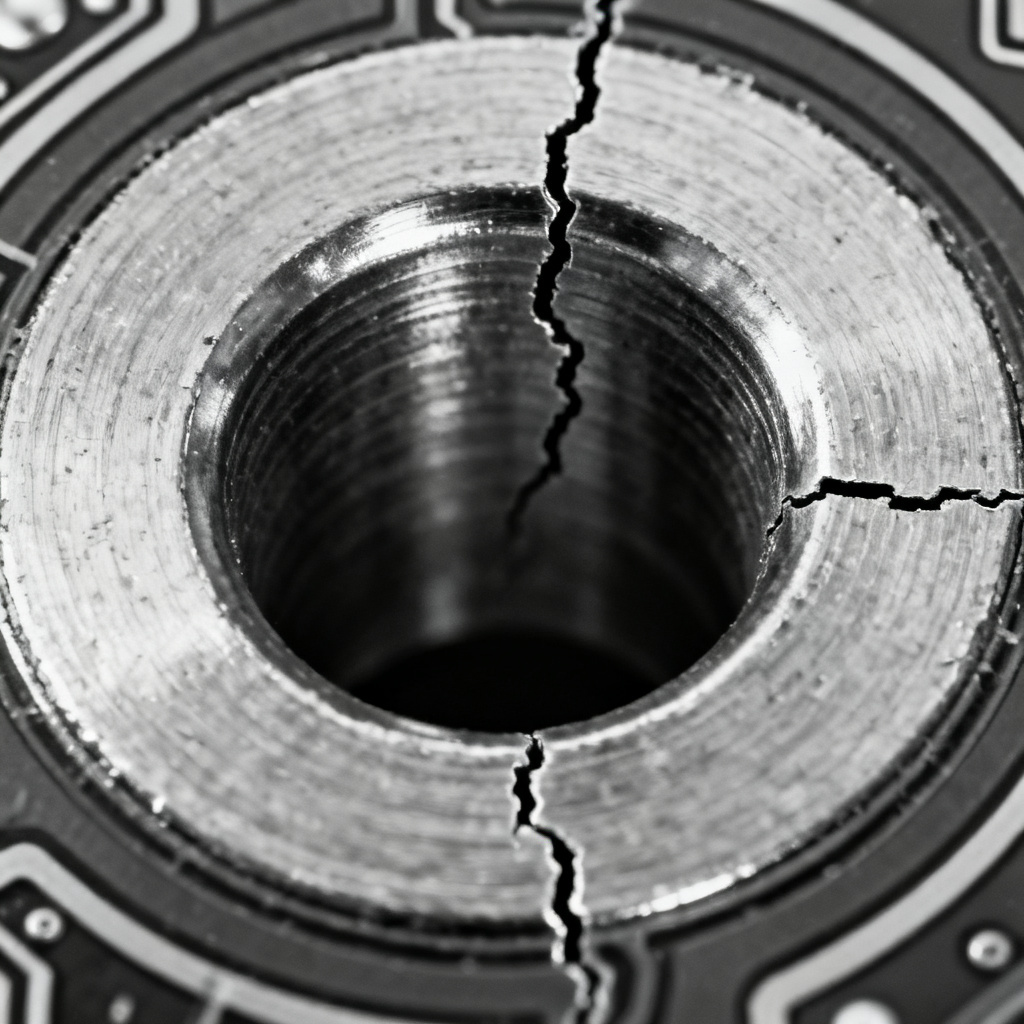
The most common failure mode in PCBs is barrel cracking in PTHs due to Z-axis expansion. When the board is heated, the laminate expands in the Z-direction while copper plating expands much less (CTE ~17 ppm/°C). This mismatch creates tensile stress on the copper barrel. Over multiple thermal cycles, this stress causes barrel cracking. For applications with repeated temperature changes—automotive under-hood, aerospace—low CTE materials are mandatory.
Z-Axis CTE Above Tg
This is the most important number in any Material Properties Database. While CTE below Tg might be 50–60 ppm/°C, CTE above Tg can jump to 250–350 ppm/°C. High-Tg materials often have lower CTE above Tg because the resin system is more highly cross-linked. Adding inorganic fillers like silica or ceramic significantly reduces CTE, achieving Z-axis CTE values below 200 ppm/°C above Tg.
Typical CTE Values for Common Materials
| Material Properties Database – CTE Category | Z-CTE Below Tg (ppm/°C) | Z-CTE Above Tg (ppm/°C) | X-Y CTE (ppm/°C) |
|---|---|---|---|
| Standard FR-4 (Low Tg) | 50–60 | 300–350 | 14–18 |
| Mid-Tg FR-4 (e.g., Isola 370HR) | 45–55 | 200–250 | 13–16 |
| High-Tg / Low-CTE (e.g., Isola FR408HR) | 40–50 | 150–200 | 11–14 |
| RF / Microwave (e.g., Rogers 4350B) | 30–40 (overall) | 30–40 (overall) | 10–12 |
| Polyimide (e.g., DuPont Kapton) | 50–60 | 50–60 | 12–16 |
Measurement Methods
IPC TM-650 2.4.24 (TMA Method) is the standard method for measuring CTE, providing both CTE below and above Tg. IPC TM-650 2.4.41 measures expansion after moisture conditioning for reliability testing. Balanced construction with symmetrical stackup minimizes warpage caused by CTE mismatch between copper foil and laminate.
How to Use This Material Properties Database for Your Next PCB Project
When selecting a material for your custom PCB, follow this hierarchy using the Material Properties Database:
Operating Frequency: For <1 GHz, standard FR-4 (Tg 140°C, Dk 4.5, Df 0.02) is sufficient. For >1 GHz, move to low-loss materials (Df <0.01). For >10 GHz, RF-grade materials (Df <0.005) are required.
Thermal Environment: If exposed to lead-free soldering (260°C) or continuous high-temperature operation (>100°C), choose High-Tg material (>170°C). For severe thermal cycling, prioritize low Z-axis CTE (<200 ppm/°C above Tg).
Signal Integrity Requirements: For high-speed digital (10 Gbps+), tight Dk tolerance (±0.05) and low Df are critical. Consider spread glass weave to minimize Dk variation.
Layer Count and Thickness: High-layer-count boards (>12 layers) require materials with low Z-axis expansion to prevent PTH failures. High-Tg, filled-resin systems are standard here.
Common Material Comparisons at a Glance
| Material Grade | Tg (DMA, °C) | Dk (1 GHz) | Df (1 GHz) | Z-CTE (above Tg, ppm/°C) | Best For |
|---|---|---|---|---|---|
| Standard FR-4 | 140 | 4.5 | 0.020 | 300 | Low-cost, low-frequency |
| Isola 370HR (Mid-Tg) | 180 | 4.3 | 0.012 | 220 | Multilayer, mid-speed digital |
| Isola FR408HR (High-Speed) | 200 | 3.9 | 0.008 | 180 | 10G backplanes, high-speed |
| Rogers 4350B (RF) | >280 | 3.48 | 0.0037 | 35 (overall) | 5G, radar, mmWave |
| Panasonic MEGTRON6 | 210 | 3.4 | 0.002 | 150 | High-end server, AI |
Industry Terminology Explained
Plated Through-Hole (PTH): A hole in a PCB with copper plating on its walls, used for electrical connection between layers. PTH reliability is directly affected by Z-axis CTE.
Impedance Control: The process of maintaining a consistent characteristic impedance for transmission lines, primarily determined by Dk and trace geometry.
Insertion Loss (S21): The loss of signal power resulting from the insertion of a device in a transmission line, heavily influenced by Df at high frequencies.
Thermal Cycling: Repeated exposure of a PCB to temperature changes, testing the endurance of materials against CTE mismatch.
Comparison: Our Material Expertise vs. General Suppliers
Unlike generic PCB manufacturers who offer limited material options, our team provides comprehensive Material Properties Database guidance, sourcing from all major laminate brands including Isola, Rogers, Panasonic, and Nelco. We help you select the optimal Tg, Dk, Df, and CTE combination for your specific application—whether it’s 5G radar, automotive ADAS, or high-speed networking. Our engineering team reviews your stackup and thermal requirements to ensure first-pass success, reducing prototype iterations.